

If you’re a follower of stock market news, you’ve most definitely come across different headlines such as “Sell in May and go away” “End of the year stock market rally” or “The January effect something or other”.
This got me wondering whether there is any truth to stock market seasonality.
So, once again, Investing Aid will investigate!
I gathered this data from the S&P 500 performance history and compiled it into graphs that I think are both simple and informative.
There are, of course, many other stock indices I could’ve used, but since the U.S. market is the most widely followed, I believe it offers the best basis for research.
A word of warning, though, before we venture ahead. Everything in this article is meant merely as a curiosity, not to be taken too seriously.
When it comes to the stock market, there’s a lot more going on than first meets the eye. What you see here is an oversimplification of stock market performance. It’s by no means completely accurate, but it does raise some interesting points.
What Are the Best and Worst Months for the Stock Market
Let’s begin by sorting out the S&P 500 monthly performance data from 1950 to 2023.
The monthly average returns are:
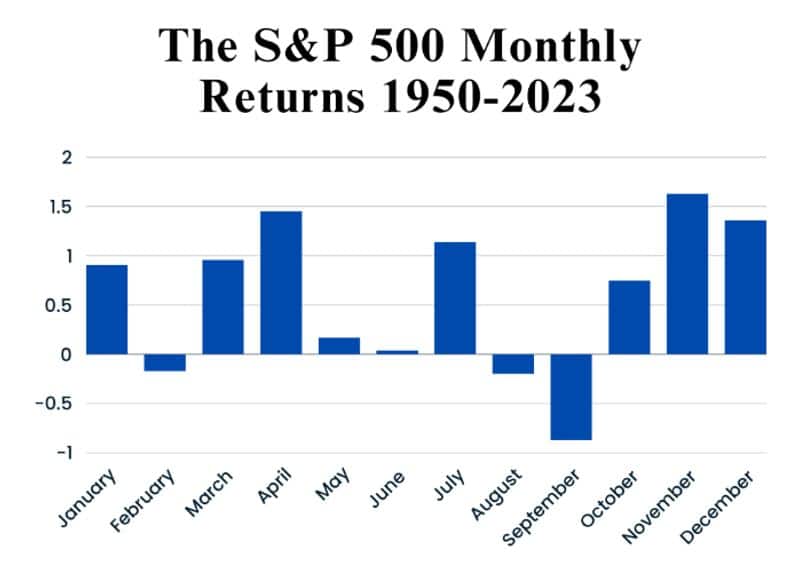
The results are quite obvious – stocks tend to perform better during certain months. Then again, a lot can change in over 70 years, so let’s see how the S&P 500 has fared in the 21st century:
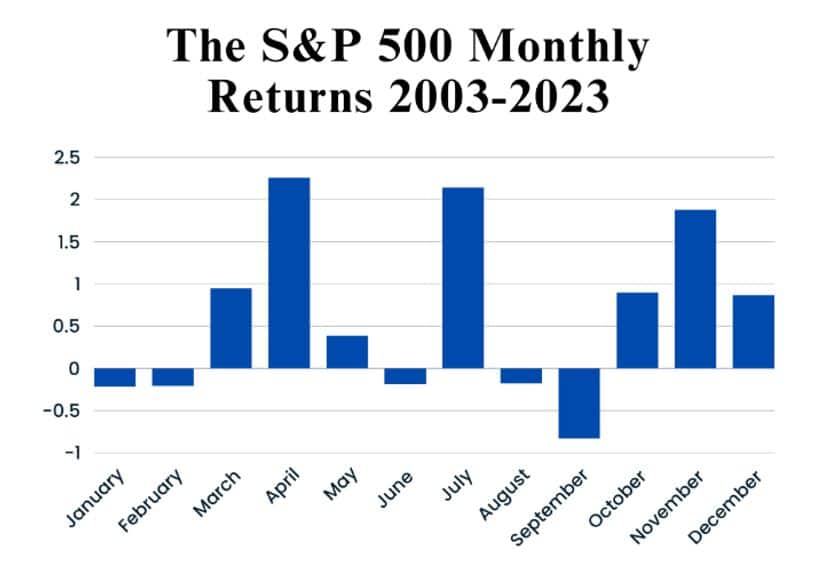
The results are mostly the same, except for January, which seems to have taken a major dive in the past 20 years.
Be that as it may, it’s clear that there seem to be seasonal patterns to equity market returns. It’s worth remembering, though, that this doesn’t mean that there haven’t been bad Aprils or great Septembers.
Let’s take a look at the best months next.
The Best
When we look at the data, the best months seem to be:
- April
- July
- November
- December
Now, what can we conclude from this data? Well, the first conclusion would be that the end of the year seems to be generally better than the beginning. According to this, investors would make superior returns by buying on September lows and selling right at the end of December.
Second, the five months between April and October seem to be somewhat disappointing for investors. There is, of course, the highly performing July, but overall, the stock market seems to be slagging off during the summer months.
…and the Worst
According to this data, the worst months would be:
- February
- May
- June
- August
- September
As you can see from the graphs, by far the worst month for investors has been September. We’ll take a closer look at September later on, but first, let’s discuss a little bit about January.
The January Effect
Perhaps the most famous of all stock market anomalies is the January effect. The idea is that there is a seasonal anomaly concerning January, where stock prices tend to rise more when compared to the rest of the year.
Let’s separate January from our previous charts and see what the average January return has been on the S&P 500 per decade from 1950 to 2019. As we can see, January has been a good month for stocks:
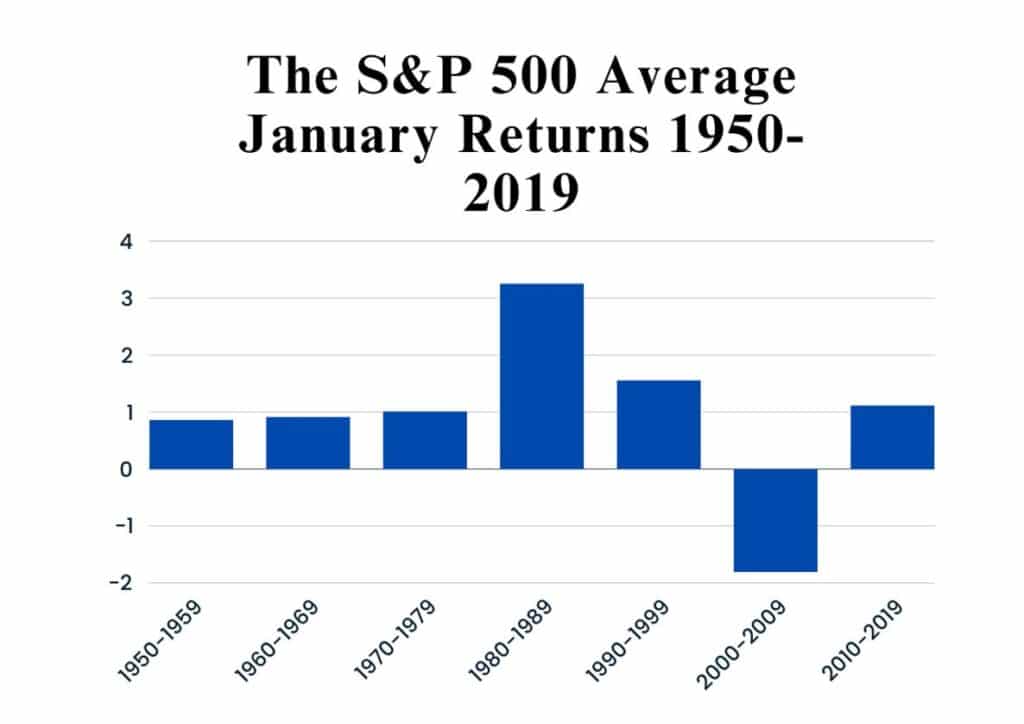
As we can see, January has generally been a favourable month for stocks.
So, should investors try to time their transactions in hopes of benefitting from the January effect?
While it may, at first, seem like a great idea, there’s one major problem: it’s impossible to know beforehand in which years the January effect works.
For example, between 2010 and 2019, the S&P 500 went up 6 times out of 10 in January. Between 2000 and 2009, only 4 times out of 10. Between the greatest decade of 1980-1989, the stock market went up 7 times out of 10 in January.
Even if you had a 70% probability of the January effect, there’s still a very real chance it might not pan out. For comparison, in 1987, the S&P 500 went up 13.18% in January. In 1981, it went down 4.57%.
To summarize, investors have no reliable way of telling whether the January effect will work.
The September Blues
While January seems to be full of cheer, September most definitely is not. Let’s examine the worst month in the market the same way we examined the January effect.
As can be expected, the data does not look good:
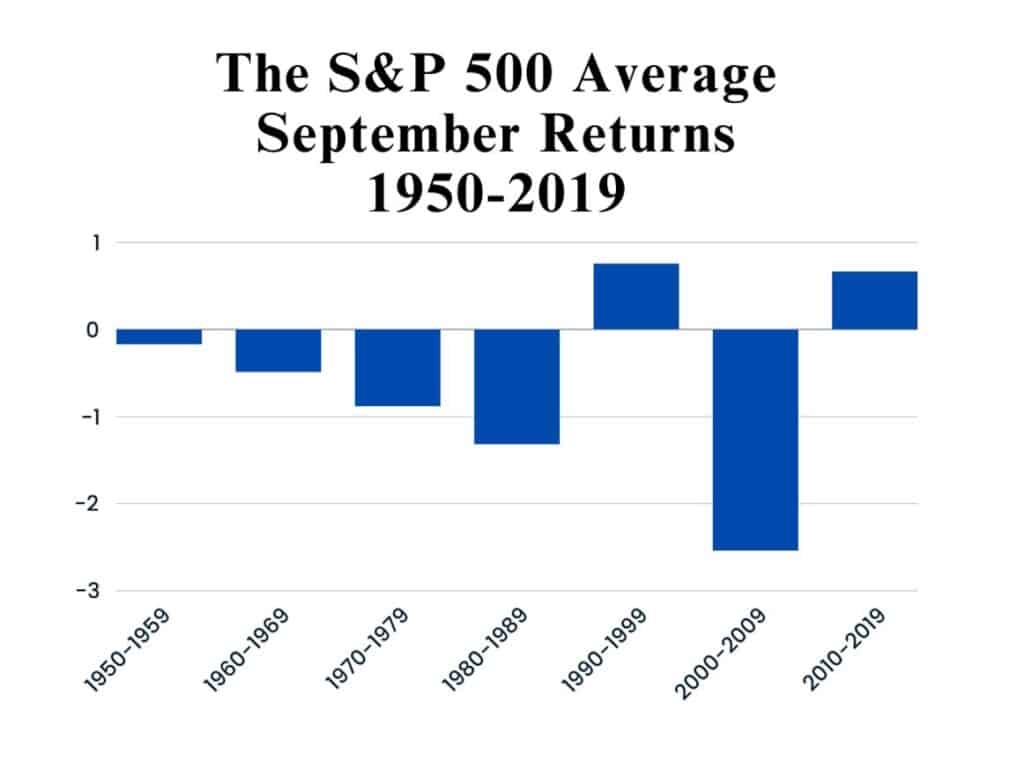
September truly seems to be the Jar Jar Binks of stock market returns.
There have been a lot of different explanations for the September effect ranging from tax loss harvesting to fund managers deciding to sell stocks after summer vacations. In any case, September is not a favourable month for equity holdings.
The Santa Claus Rally
We all like Christmas and getting presents, but does Santa visit the stock market?
There’s only one way to find out, so let’s bring in the data:
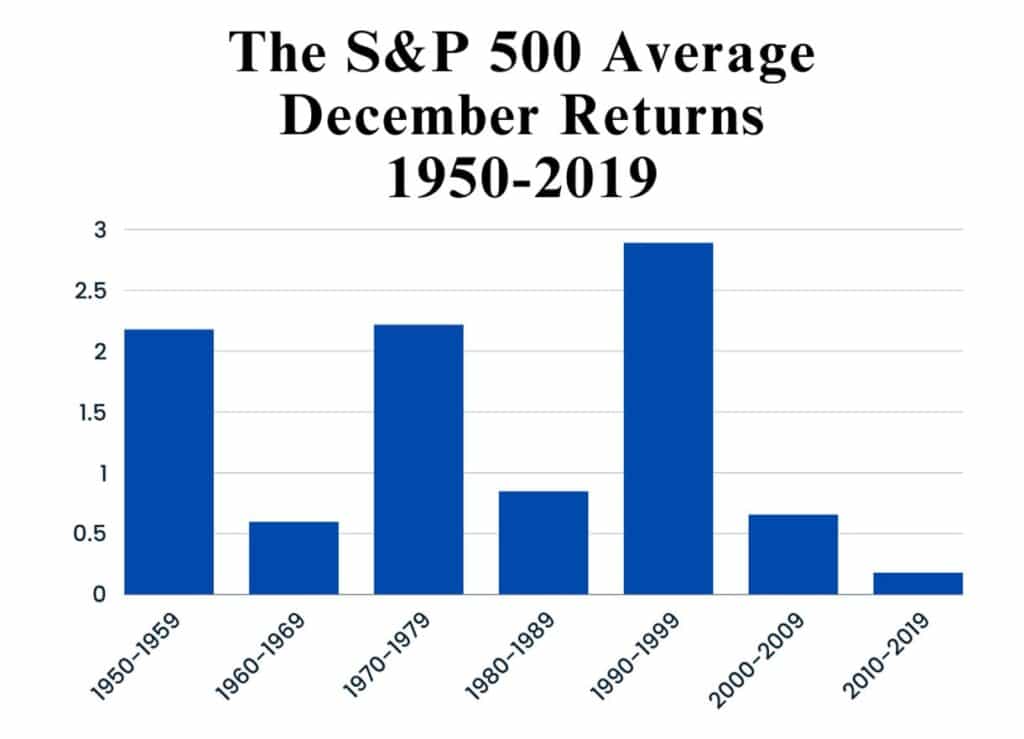
Well, all I can say is Merry Christmas to everyone!
December truly seems to offer superior positive returns compared to most of the year. Remarkably, there hasn’t been a single decade with negative returns. One explanation for the December rally is that big institutional investors and fund managers tend to make big moves at this time of the year.
Interestingly enough, while December usually gets all the attention, it’s November that has granted even better results – especially in the past two decades. Now, it may be that investors tend to anticipate the end-of-the-year rally, which would mean they start to buy stocks earlier in November.
In any case, the last quarter of the year does indeed favour the equity markets.
Should You Make Investment Decisions Based on Market Seasonality
We’ve gone through a lot of interesting data, and there seems to be a certain pattern when it comes to yearly stock market performance.
So, there’s only one question remaining: should you make decisions based on all this?
At first, it may feel like a perfectly fine idea to stay invested only for the months with higher returns. In theory, this should grant superior returns in the long run.
The problem is that in real life, it’s probably not a viable investing strategy.
First of all, you would need to make a lot of transactions and pay a lot of transaction costs, which lowers your returns.
Second, you would have to pay taxes for the possible profits which reduces your profits further.
Third, the results are somewhat inconsistent. Some years follow the data shown earlier, but some years yield exactly the opposite returns. To be able to benefit from this, investors should remain extremely disciplined for decades on end, which is easier said than done.
It’s also worth mentioning that while the broader market might do better in certain months than others, individual stocks may behave completely differently.
Overall, a successful and viable long-term investment strategy should not be based on anomalies.


